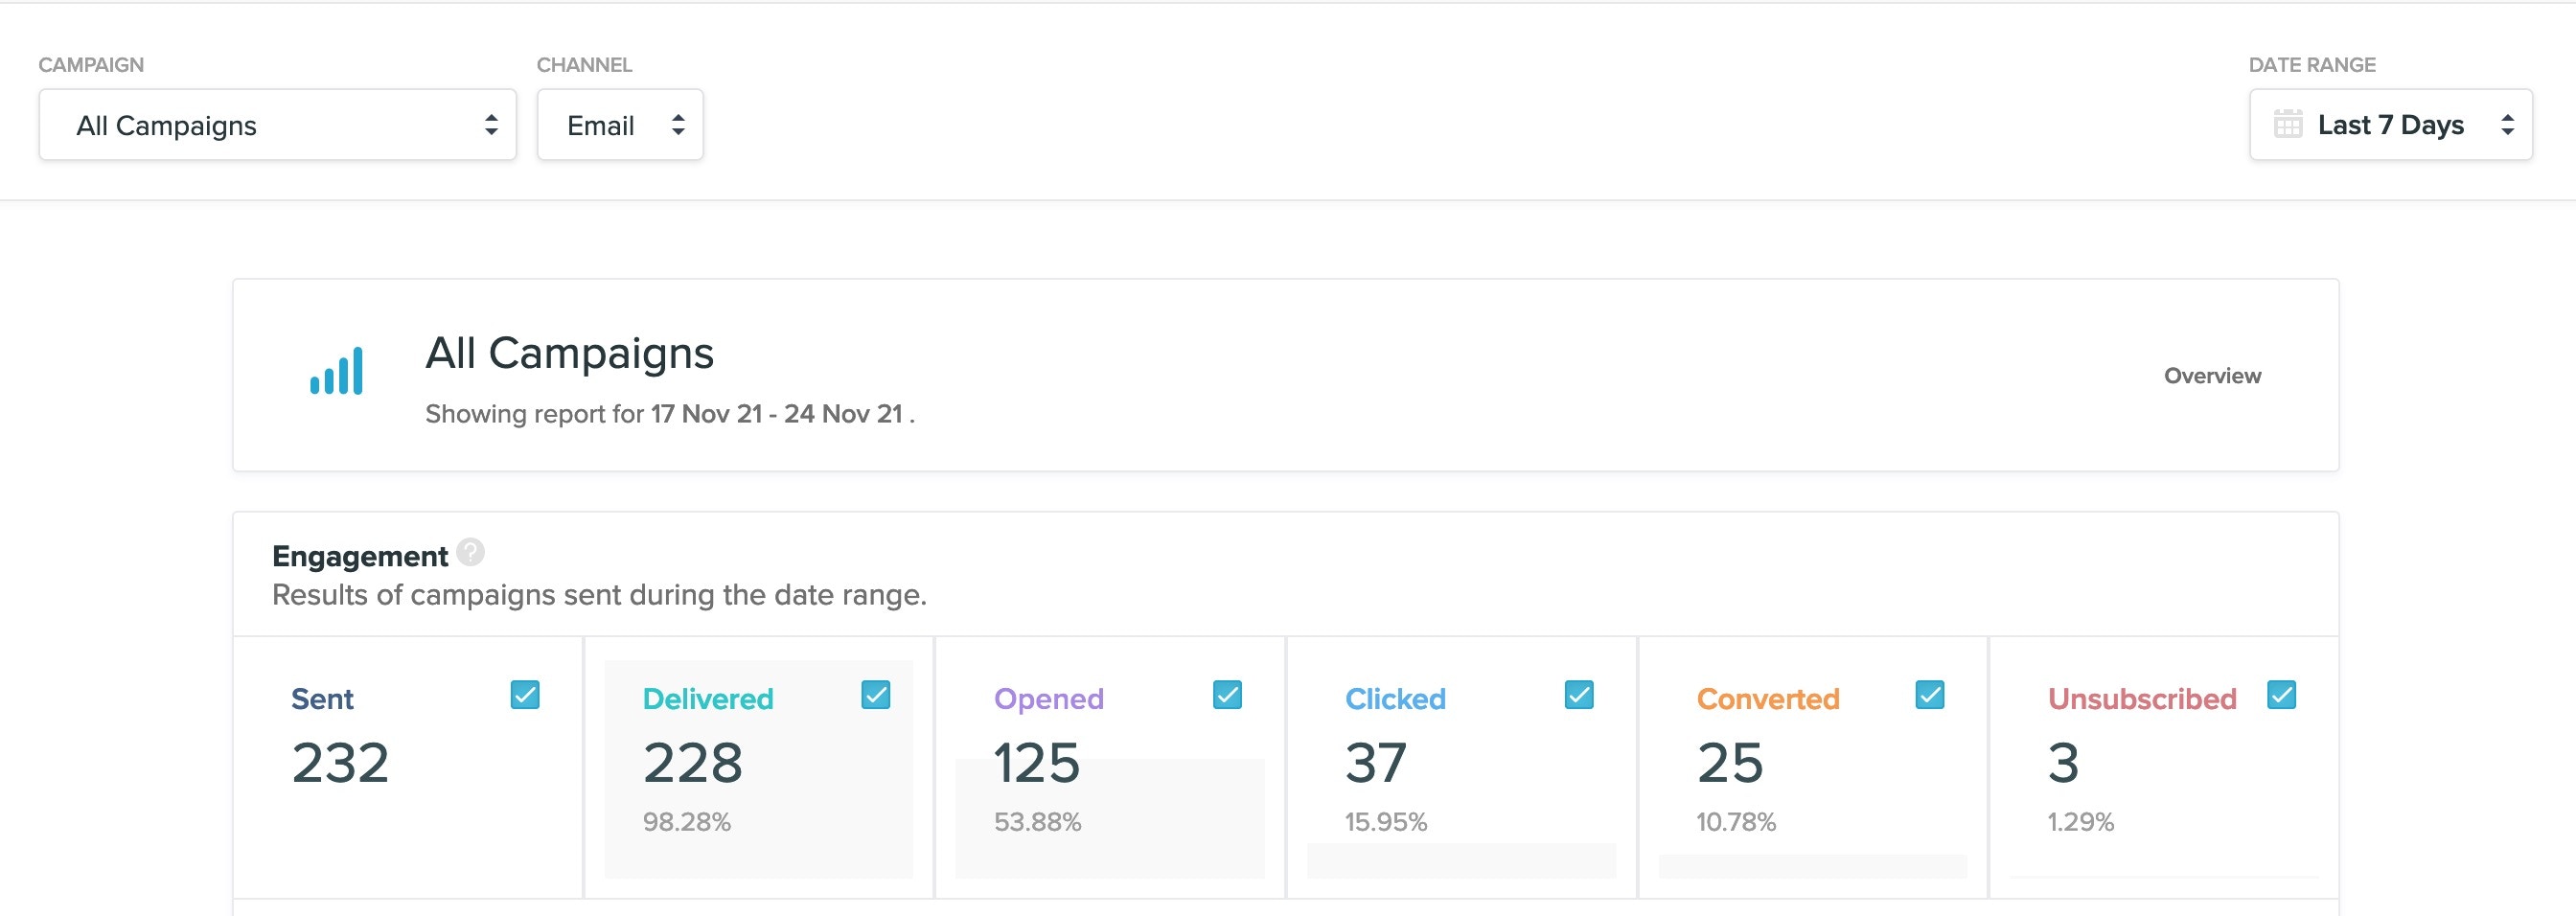
1. Engagement
You can track total send volume of your entire project over time and compare movements in customer engagement. Three different views will be displayed:- Overview: a summary of email engagement for all your campaigns within the selected date range
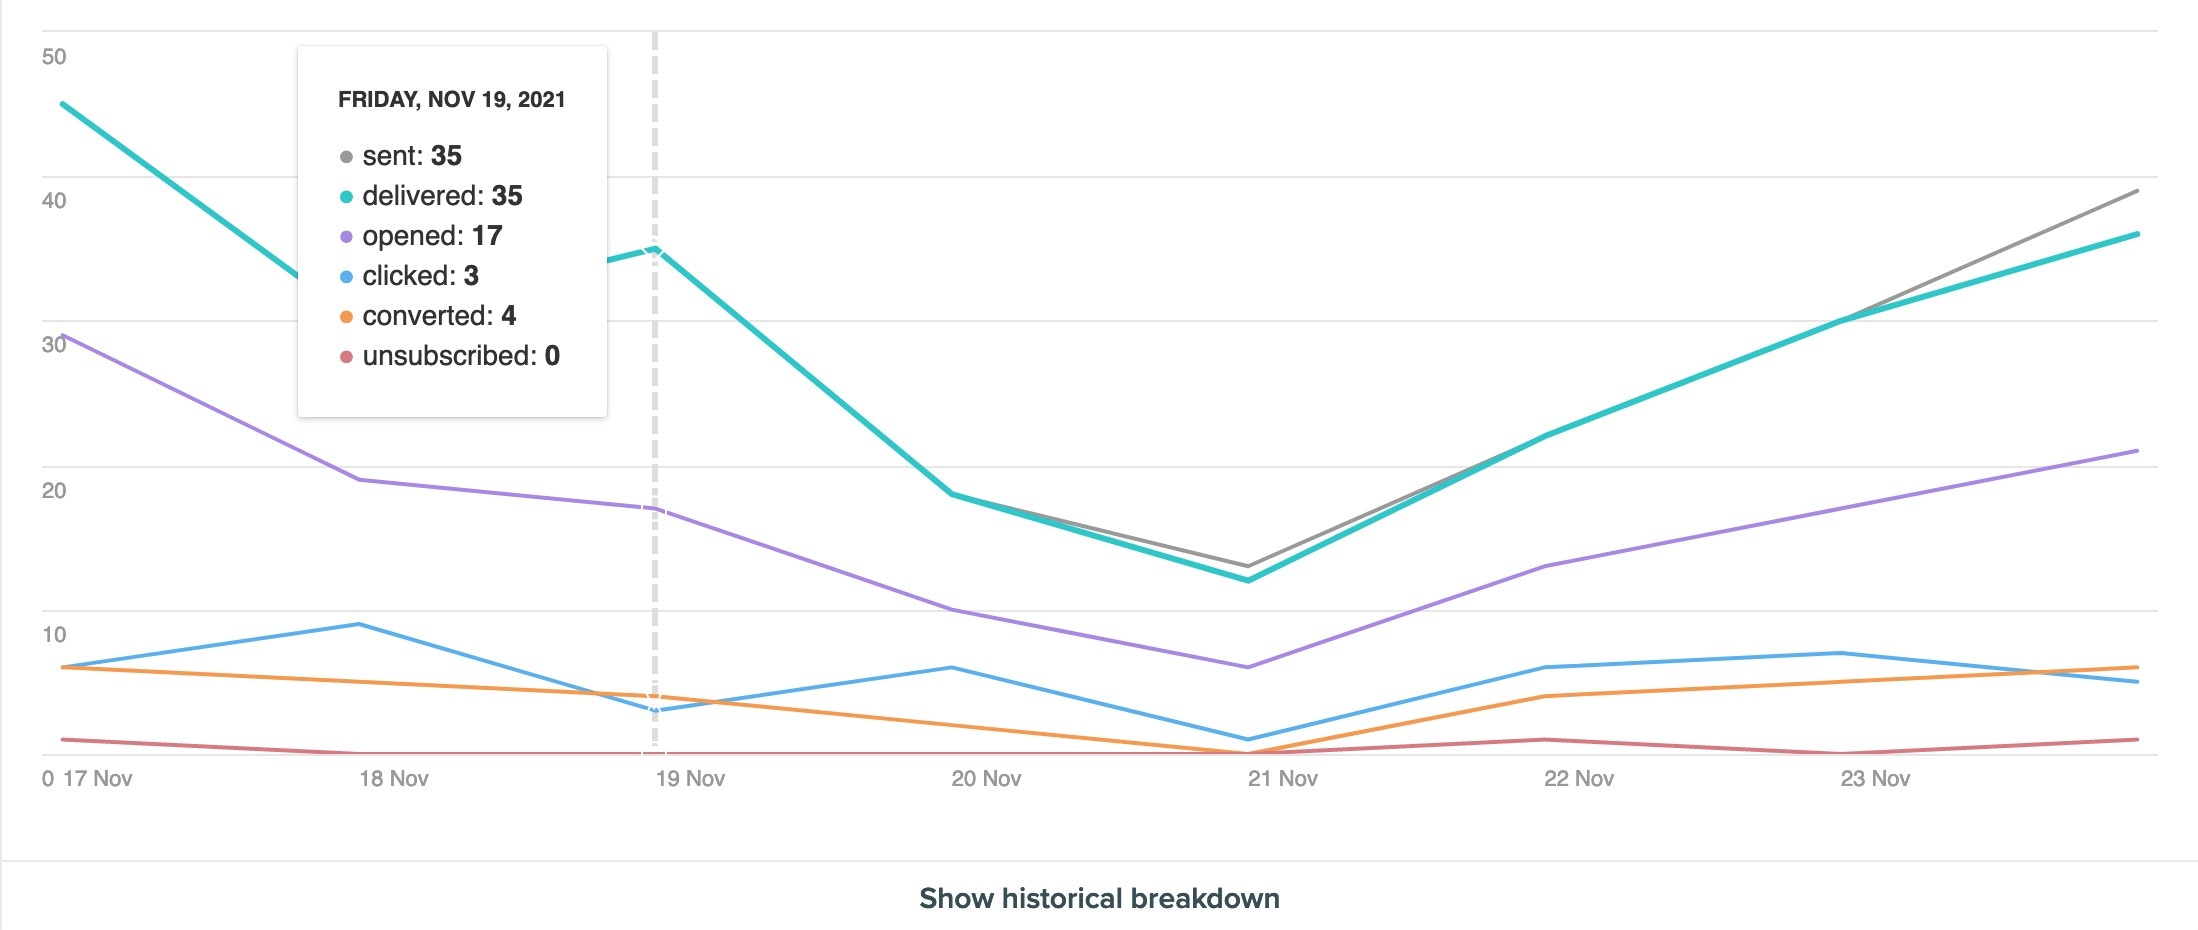
- Graph: to visualise daily email engagement and map trends
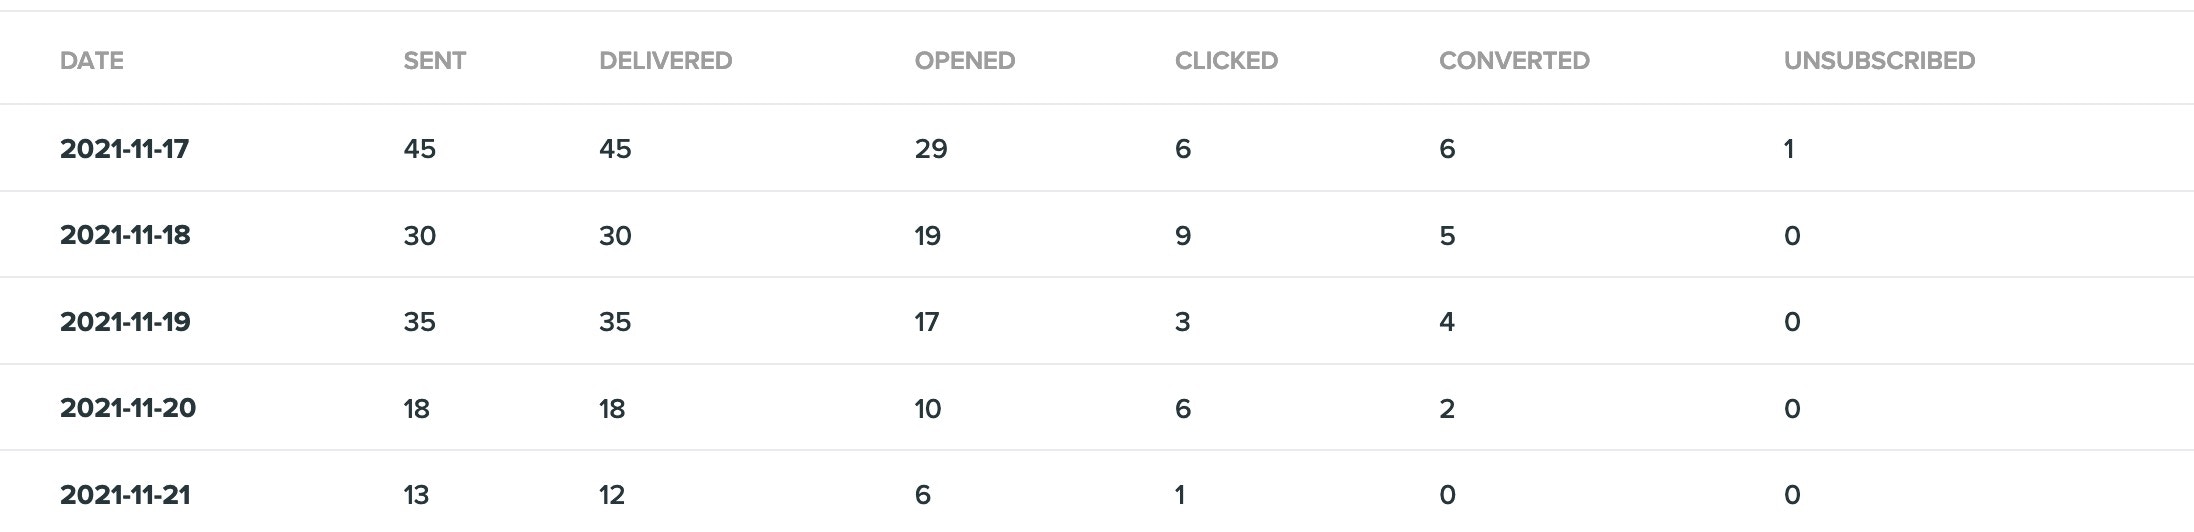
- Historical breakdown: to review daily email engagement
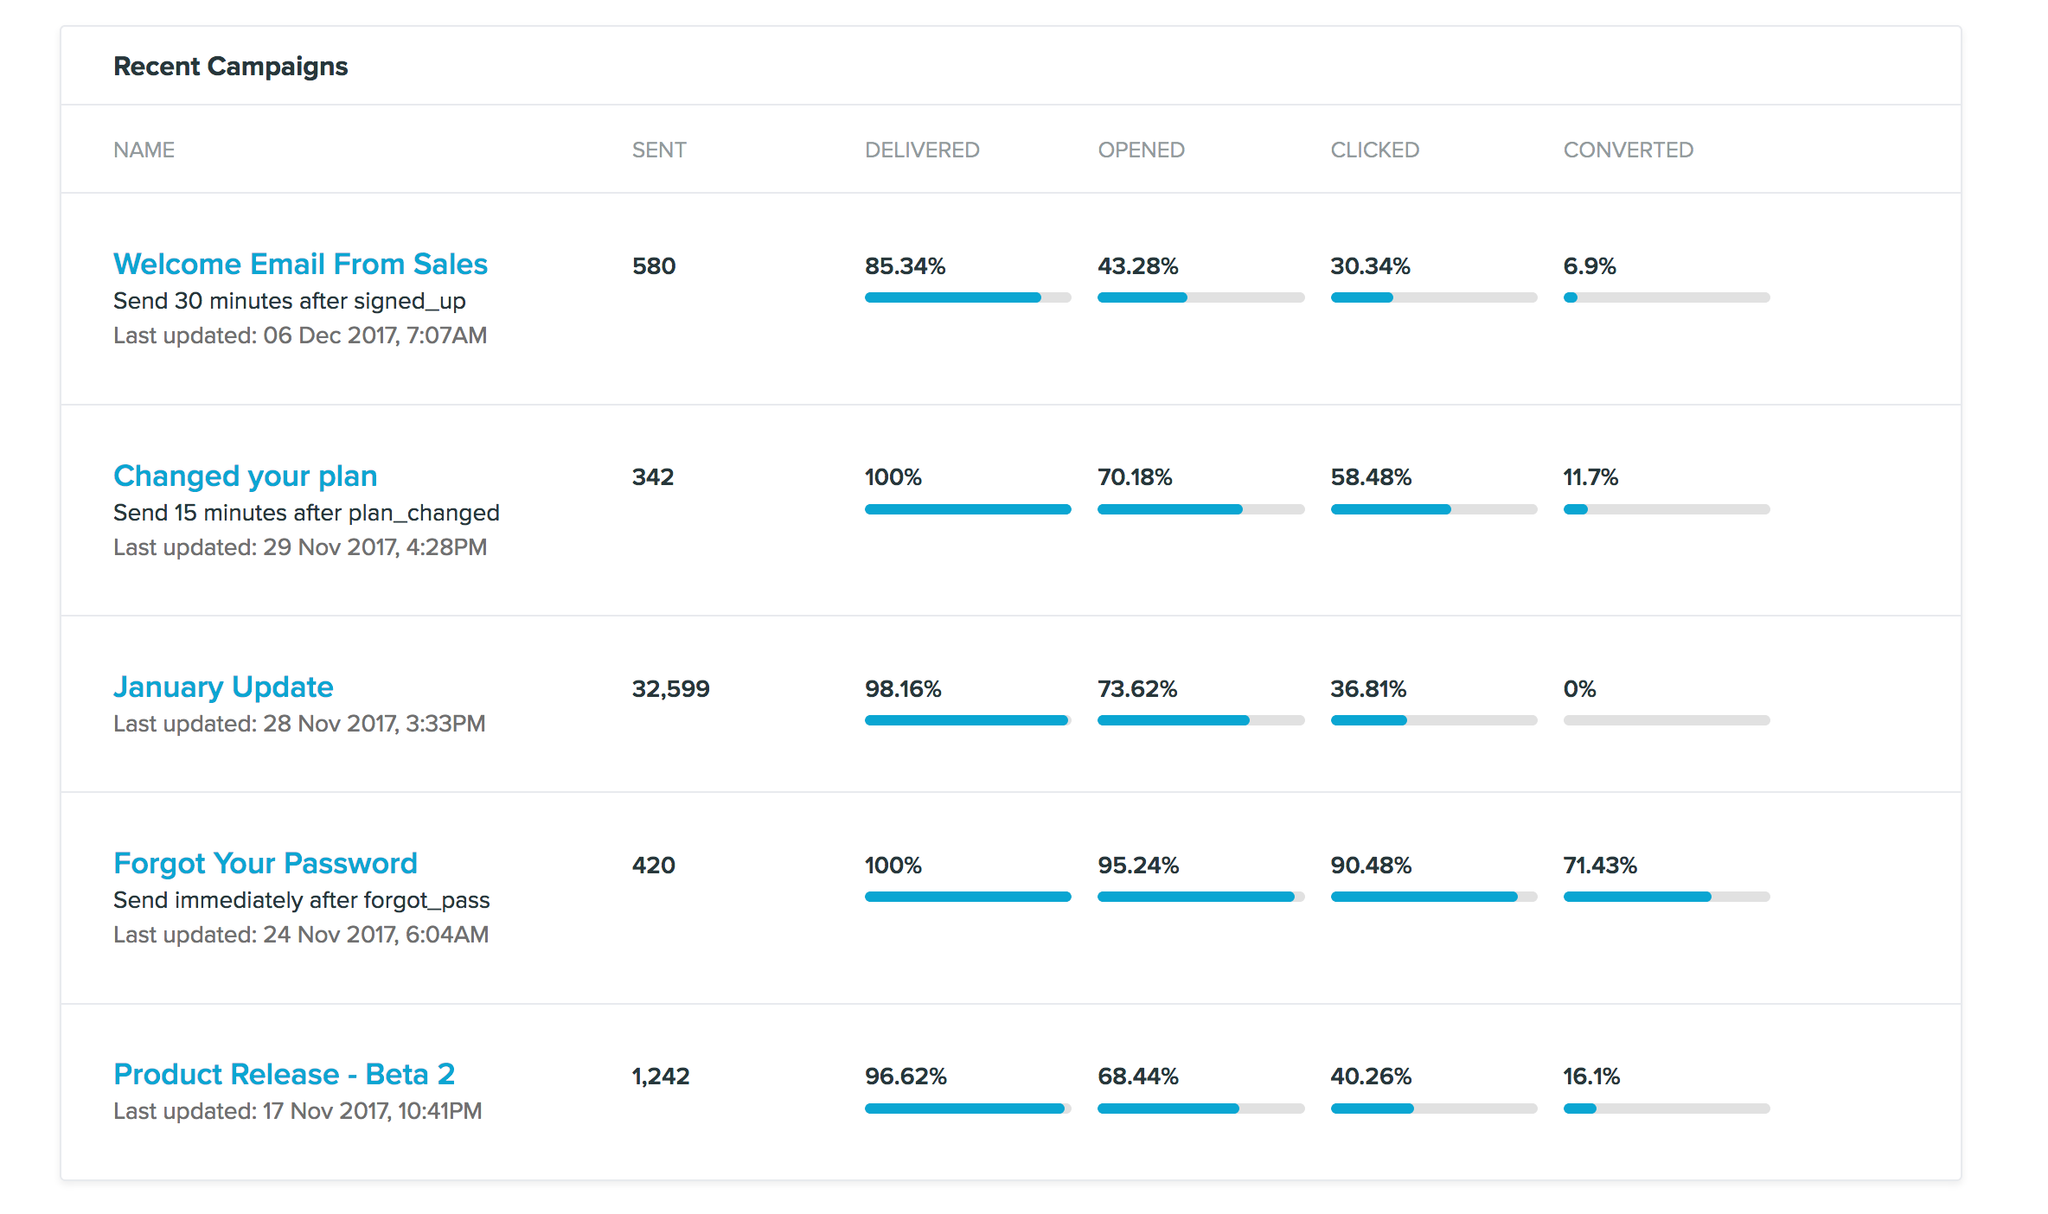
2. Recent Campaigns
You can compare the email performance of your five most recent newsletters sent.